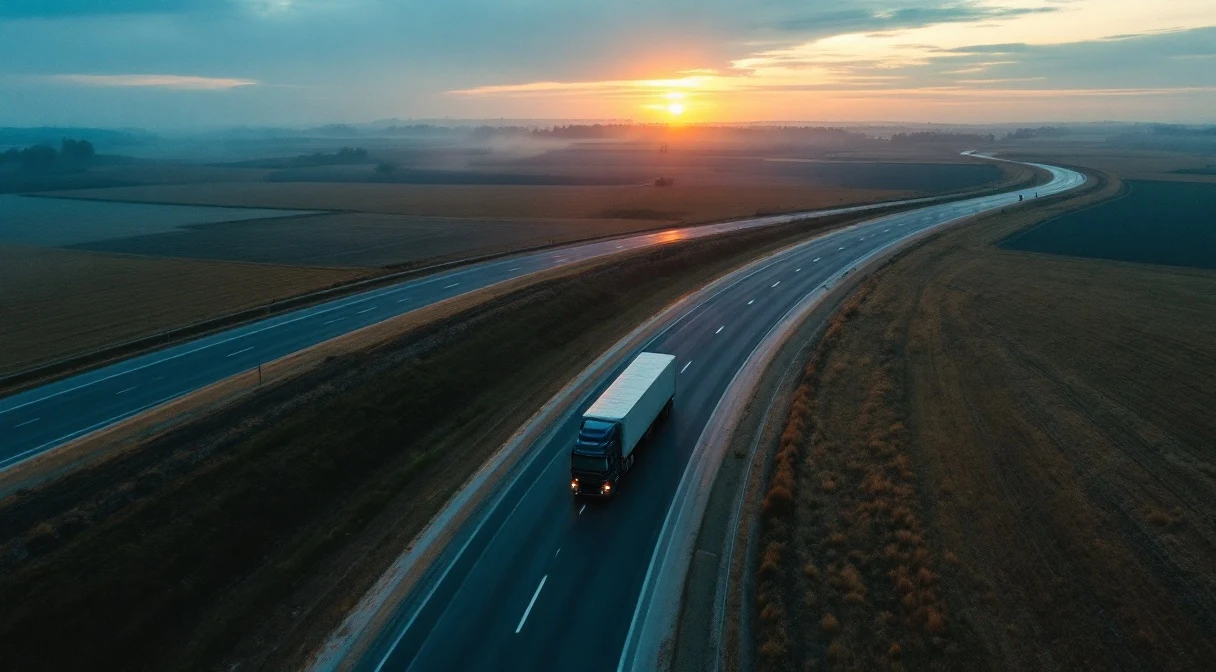
An 18-tonne truck returning with 6 tonnes is the loss type the industry normalises as “just this lane”. Fuel burns, driver hours tick, AETR window depletes — revenue on the return is zero.
Industry case: Typical EU export fleets run at 18–22% empty return. A 100-truck fleet doing 12,000 km/truck × 18% = 216,000 empty km/month. At €0.10/km marginal cost, that’s €21,600/month raw loss.
The operations-intelligence gap
Three structural reasons:
- One-way contract design. Contracts price one direction; the return is empty out of “habit” rather than economic logic.
- Load factor isn’t measured. TMS records the lane, but pulling load percentage per trip manually is unfeasible.
- Load platform sits in isolation. TimoCom and Trans.eu live in a separate browser tab from the trip planner.
Plan-vs-actual tonnage + matching signal
Lognari computes a planned-vs-actual tonnage/volume ratio per trip:
| Trip | Planned tonnage | Actual tonnage | Load % | Return capacity |
|---|---|---|---|---|
| TR→PL electronics | 18 t | 17.2 t | 96% | 17.8 t available |
| PL→TR return | 0 t (empty) | 0 t | 0% | 18 t opportunity |
| AT→TR return | 8 t (partial) | 7.4 t | 41% | 10.6 t opportunity |
Empty returns accumulate by lane. Partial/return-load opportunities auto-query TimoCom/Trans.eu APIs; matches surface in the ops-centre approval queue.
Impact by fleet size
| Fleet | Empty 18%→12% impact | Annual recovery | Extra revenue trips/mo |
|---|---|---|---|
| 100 trucks | €7,200/mo | €86,400 | 6 |
| 300 trucks | €21,600/mo | €260,000 | 18 |
| 1,000 trucks | €72,000/mo | €860K–€1.2M | 60 + ESG report |
Pilot — 85-truck two-way TR–EU fleet
A fleet exporting meat/vegetables TR→EU usually returned empty. Over 6 months:
- Month 1: TimoCom + Trans.eu integration was activated. 48-hour-ahead offer system was set up.
- Months 2–3: Drivers were offered a 15% share bonus per partial load. Acceptance jumped from 58% → 91%.
- Months 4–6: 312 extra partial loads carried; average €280 contribution margin/load.
Result:
- 312 extra partial loads in 6 months
- €87,000 added revenue
- 4 customers signed long-term sustainability agreements
- CO₂ report (empty-km drop = direct emissions reduction) shared with customers
Side effect: customer contract negotiation
A fleet with low empty-km can use a “green-trip” SLA argument in new contracts. Large CSRD-reporting logistics customers (DHL, DB Schenker, Maersk) demand Scope 3 emissions reports from suppliers — two pilot fleets won 3-year framework contracts on this basis.
What’s next
If your fleet leans toward one-way lanes and return-load matching isn’t automated, your empty-km rate is likely 18%+ — a pilot makes that concrete.
Reach out via the contact section — reply within one business day.
Statistics referenced from Aon Eurasia Risk Report 2024 + KPMG European Fleet Survey 2025 + Lognari pilot data. Load-platform matching data from TimoCom + Trans.eu Q2 2026.