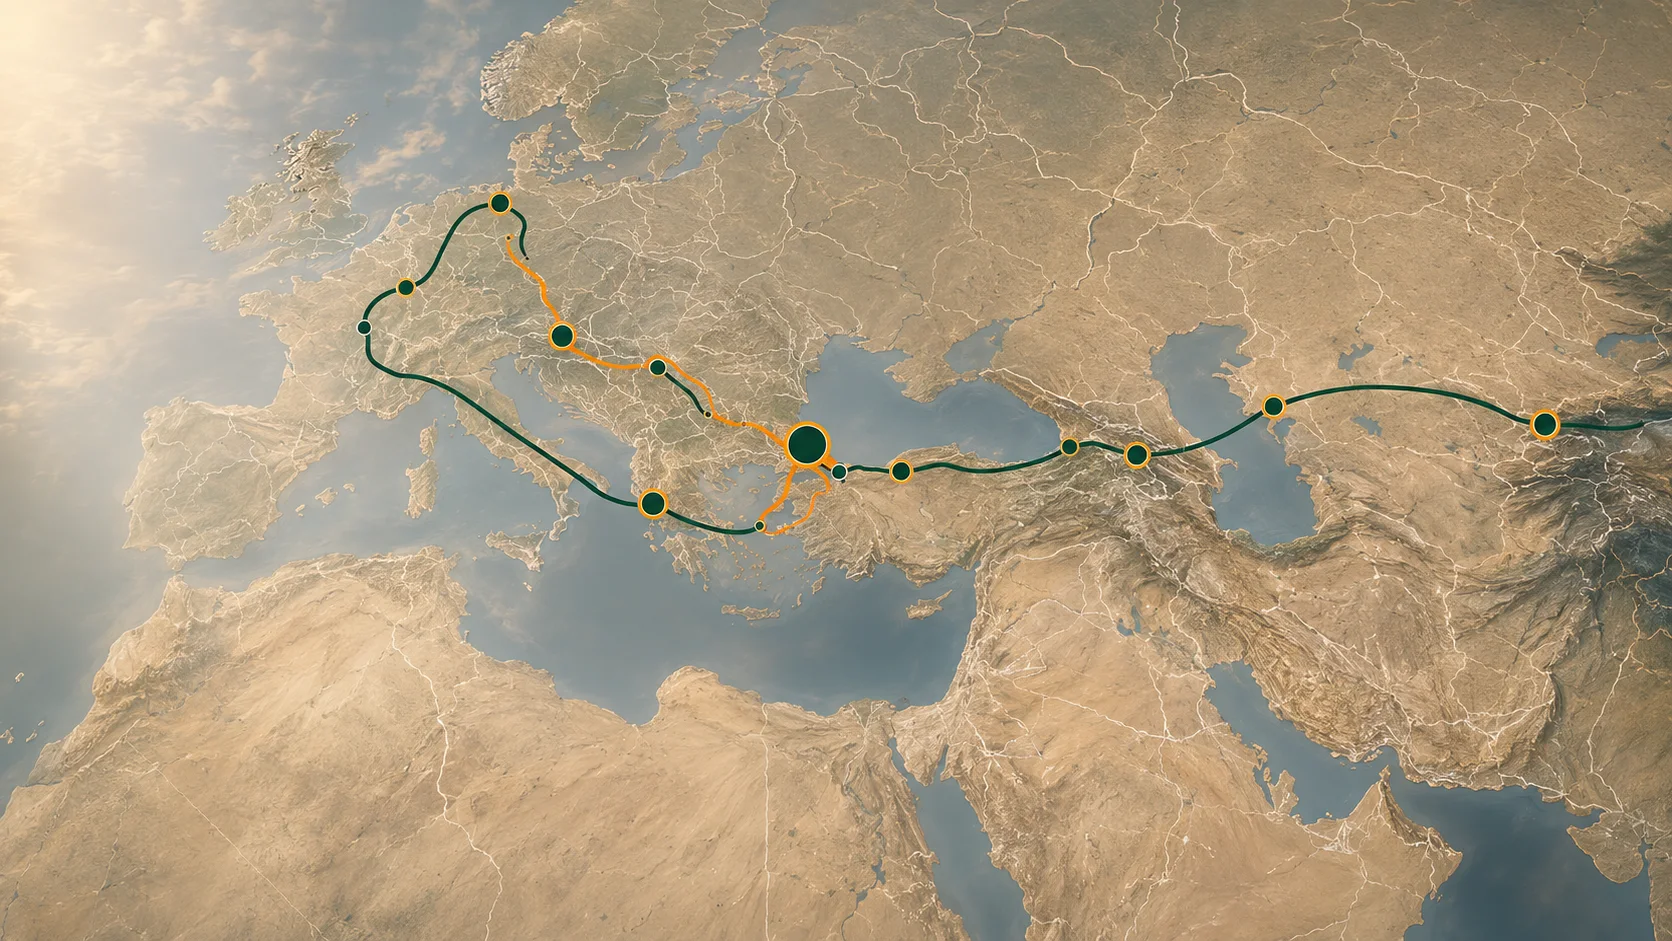
50–500 araçlık uluslararası filolar için operasyon zekâsı
Filonuzdaki görünmez kayıplarıfinansal etkiye çevirin.
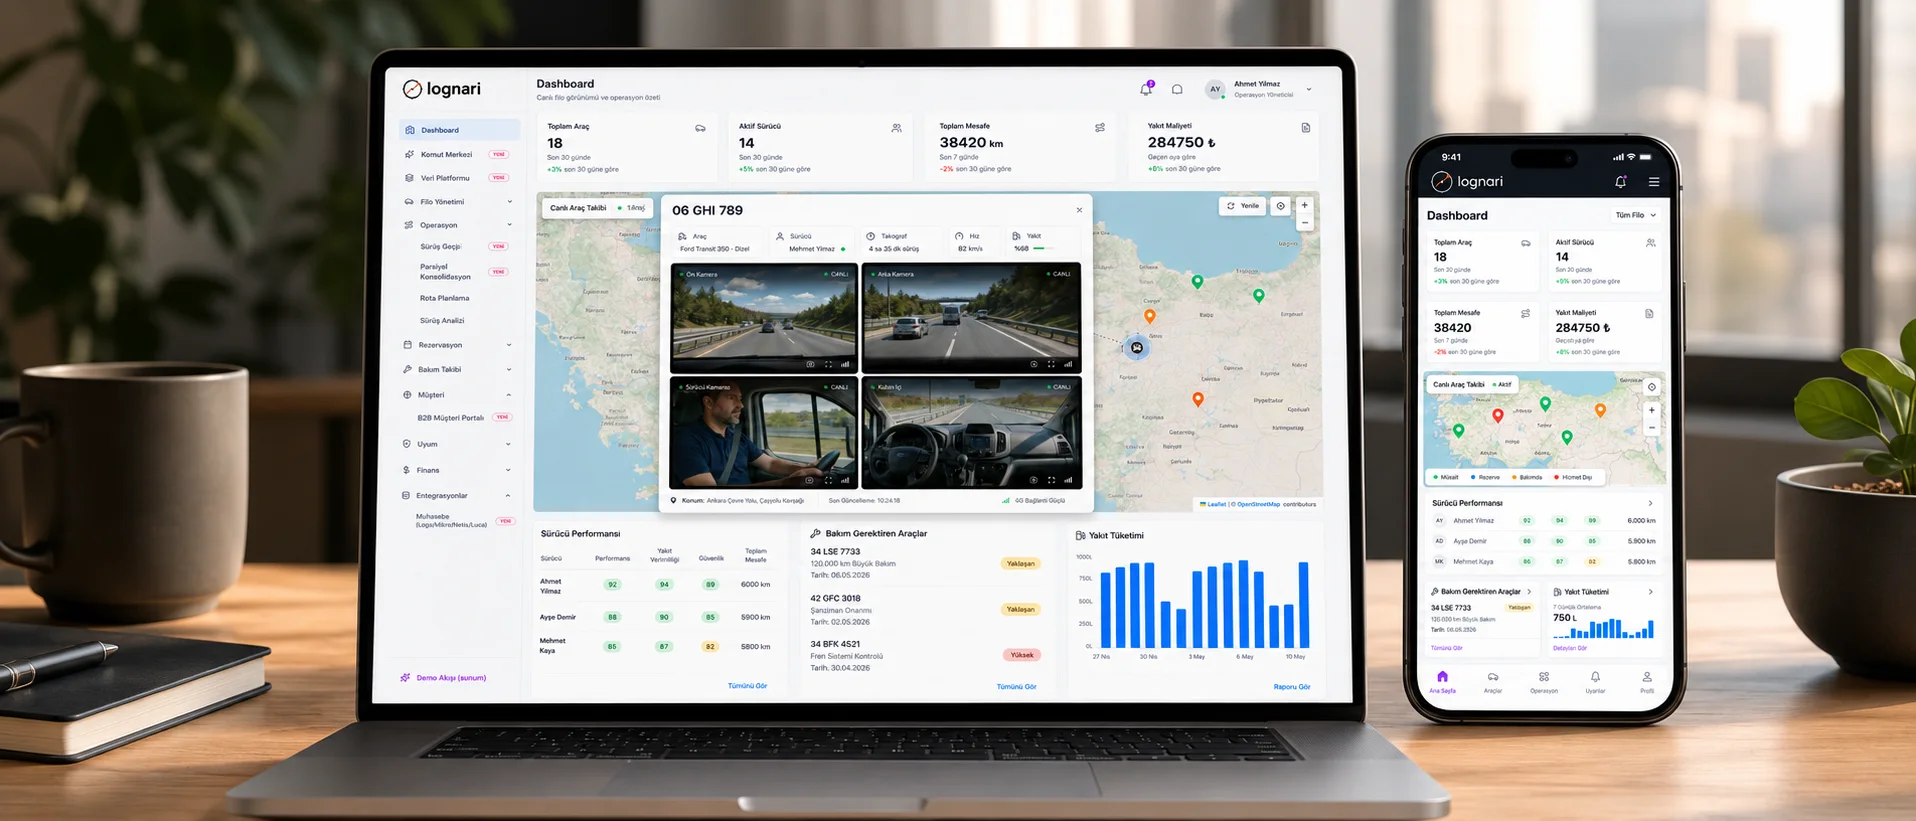
Mevcut sistemlerinize bağlanır; yakıt, bekleme, boş km, gelir kaçağı ve AETR kayıplarını tek ekranda €'ya çevirir.
Make idle loss visible
-
Fuel deviation
−12%
anomaly signal
-
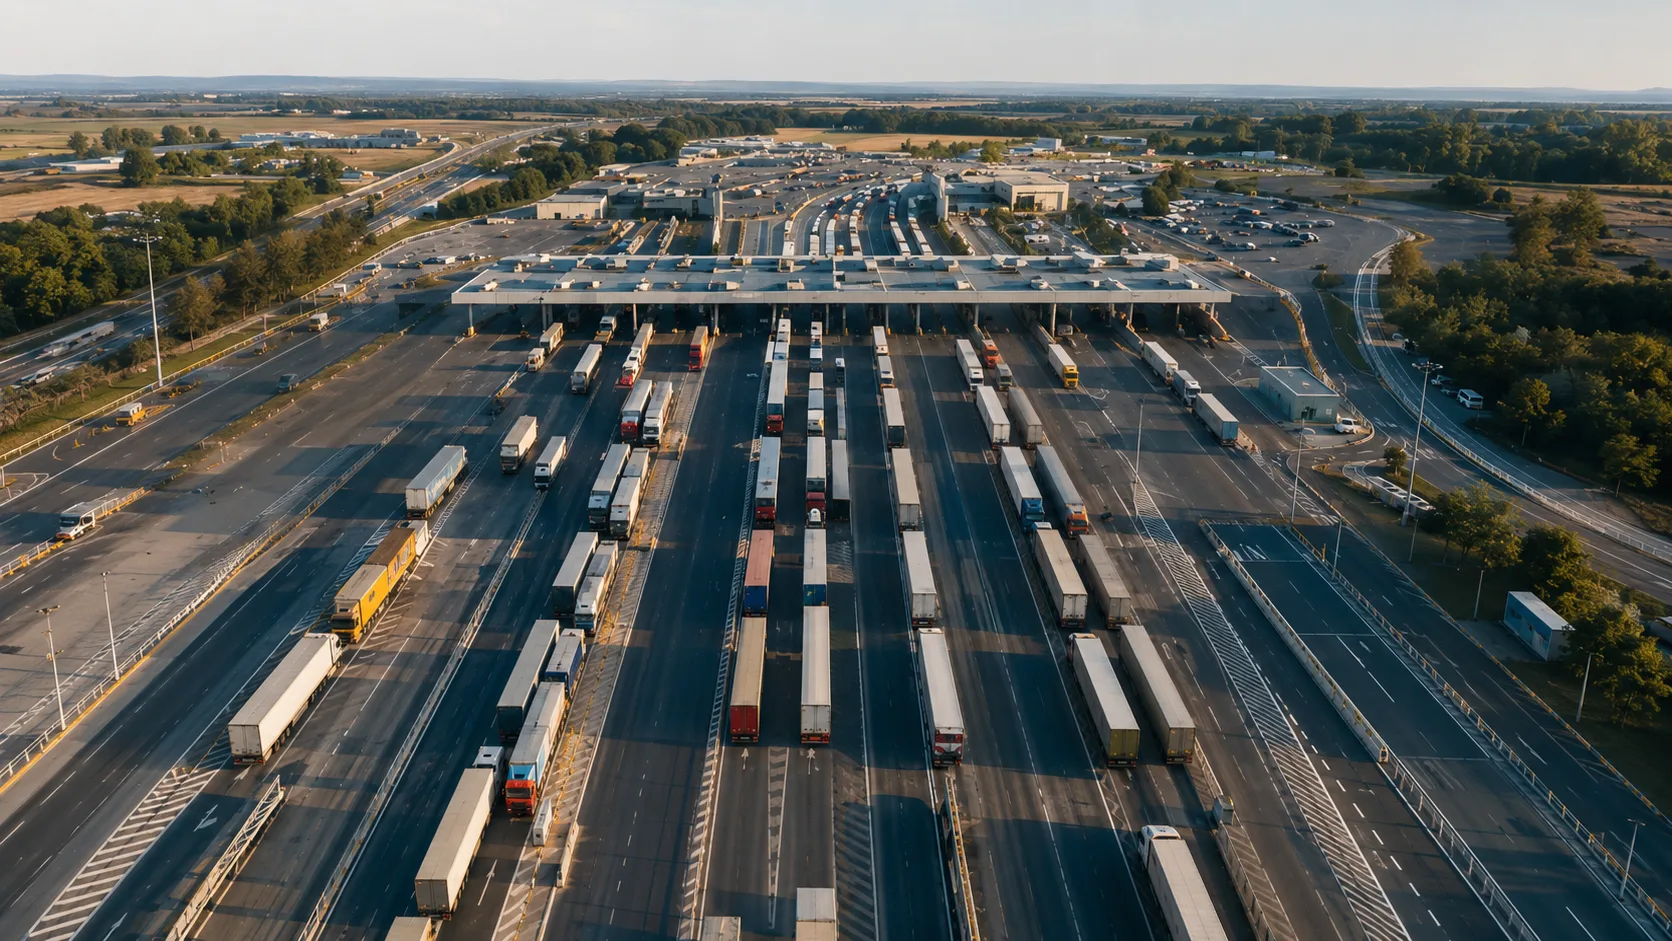
Border wait
82 min
operational impact
-
AETR risk
23 drivers
compliance alert
- Yakıt · sapma −%12
- Bekleme · Kapıkule 82 dk
- Boş km · €12.700/ay
- Gelir kaçağı · +%13 faturalanabilir
- AETR · 23 sürücü ceza riski
SAMPLE SCENARIO